Frankie MonzonSep 26, 20181 min readDynamic stock charts with PlotlyCurrently as a case study for Finance Study Group, we're analyzing the CVS/Aetna merger. As part of this case study we will be looking at...
Frankie MonzonAug 21, 20181 min readWeb scraper: Investing.pyIf you're in business valuation, are a Finance student, or are interested in the data science behind valuation, you've certainly run into...
Frankie MonzonAug 19, 20181 min readConverting csv to xtsIn a recent LinkedIn post, I've detailed a simple and effective way to convert csv data in Investing.com's format to the extensible time...
Frankie MonzonAug 19, 20181 min readYield Surface on US BondsWhile many people are familiar with the idea of the yield curve, a plot of the yields on the set of all available bonds, ordered from...
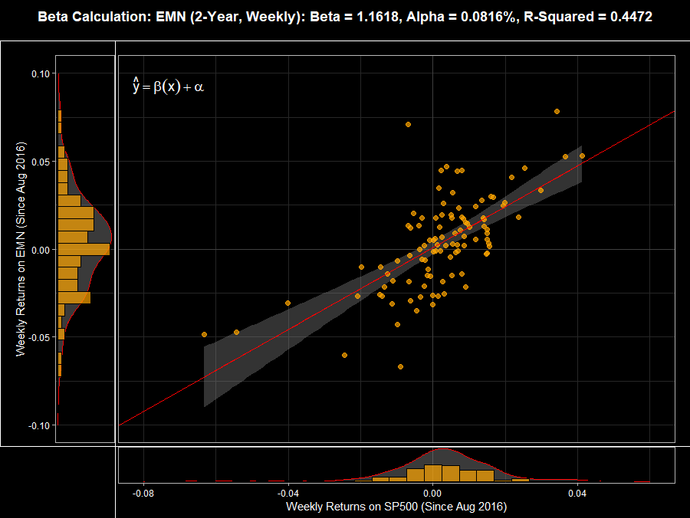
Frankie MonzonAug 19, 20181 min readDetermining Beta Values in RIn a recent LinkedIn post, I shared a function for determining beta values. The R programming language is a very useful tool for...