
Dynamic stock charts with Plotly
- Frankie Monzon
- Sep 26, 2018
- 1 min read
Currently as a case study for Finance Study Group, we're analyzing the CVS/Aetna merger. As part of this case study we will be looking at financial models of the two companies, a merger model covering the combination of the two entities' financial statements, and a valuation of the combined business.
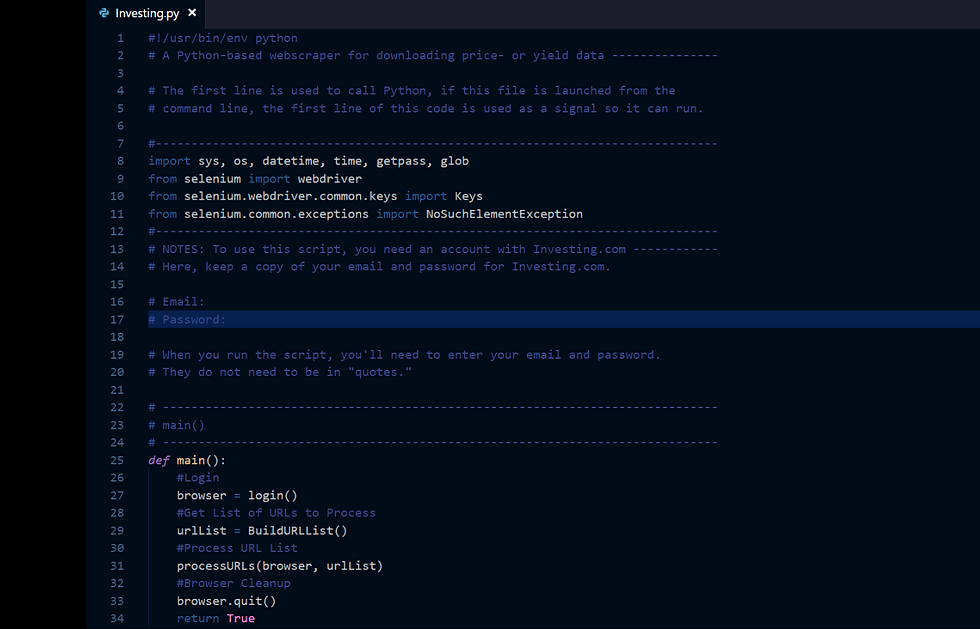
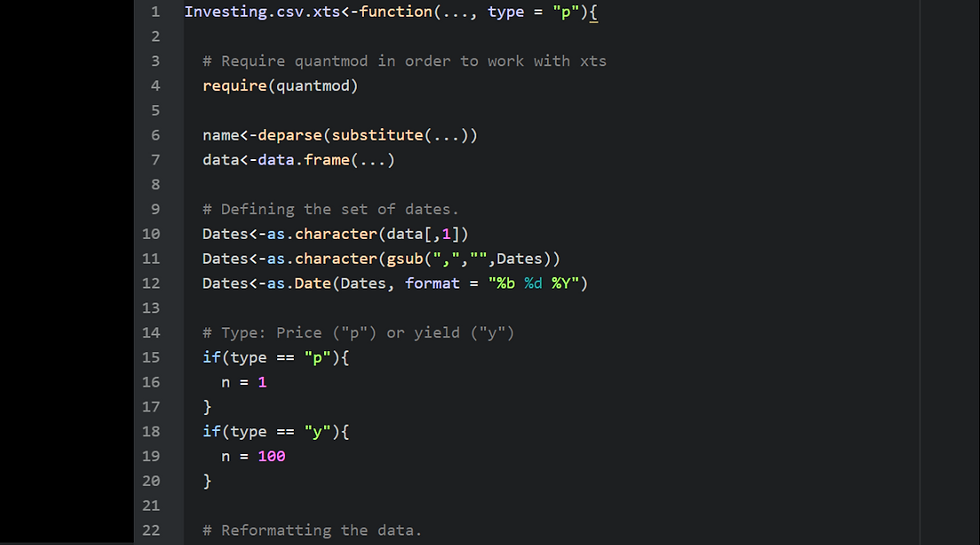
One novel piece of technology beyond the beta calculator shared to the group that I would like to bring into the reporting process are dynamic stock charts.
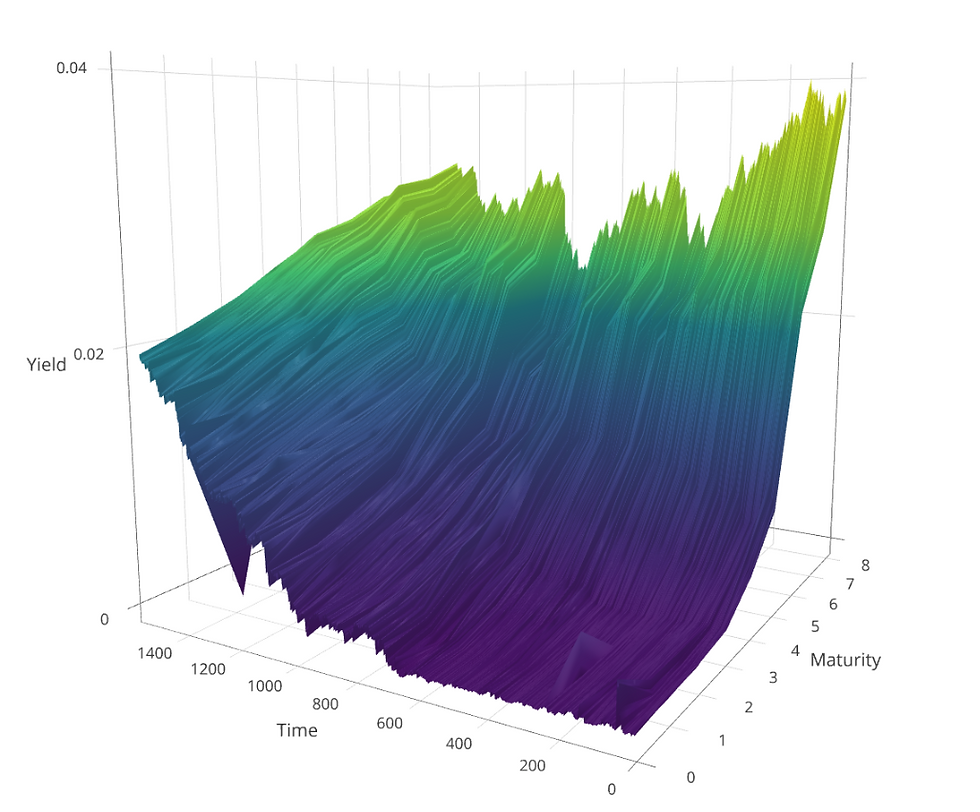
With improvements in technology, publication-quality graphics are much more accessible, and can be built more quickly than in the past.
Below is a link to my RPubs profile, including recent charts of CVS and AET, covering this year and dates significant to the deal.
http://rpubs.com/fmonzon
Comments